

- Messages : 102
- Remerciements reçus 14
This is the place for questions about learning design and pedagogy; how to use different page types for different purposes.
Variables - using user responses in a Chart page
- ymoore
-
 Auteur du sujet
- Hors Ligne
- Administrateur
-

Moins
Plus d'informations
il y a 5 ans 4 mois - il y a 5 ans 4 mois #7397
par ymoore
Variables - using user responses in a Chart page a été créé par ymoore
Hi
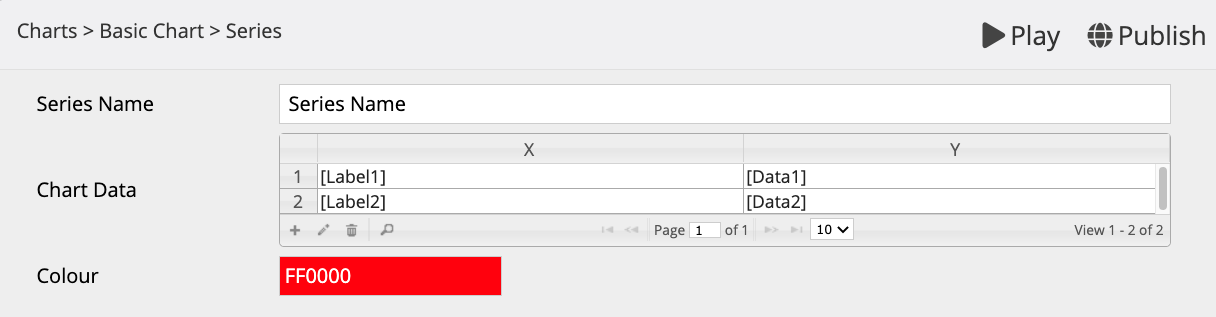
I've been trying to use variables to provide the values for a series of data in the chart page type (Xerte v3.9). Students enter the data and then the data is used to draw the chart. I have it working in the sense that the student can enter the data (a label (one variable) and a value (a second variable) but the values are not then being picked up by the chart (where I have used [variable name] in the series > chart data table - see attached screenshot). On the Chart page I have the optional property 'Variables' added and the 'Update variables' option ticked.
Am I trying something that is not possible?
Thanks
Yvonne
I've been trying to use variables to provide the values for a series of data in the chart page type (Xerte v3.9). Students enter the data and then the data is used to draw the chart. I have it working in the sense that the student can enter the data (a label (one variable) and a value (a second variable) but the values are not then being picked up by the chart (where I have used [variable name] in the series > chart data table - see attached screenshot). On the Chart page I have the optional property 'Variables' added and the 'Update variables' option ticked.
Am I trying something that is not possible?
Thanks
Yvonne
Dernière édition: il y a 5 ans 4 mois par ymoore.
Connexion ou Créer un compte pour participer à la conversation.
- ymoore
-
Auteur du sujet
- Hors Ligne
- Administrateur
-
Moins
Plus d'informations
- Messages : 102
- Remerciements reçus 14
il y a 5 ans 4 mois #7419
par ymoore
Réponse de ymoore sur le sujet Variables - using user responses in a Chart page
Would I be better off posting this in the developers forum?
Connexion ou Créer un compte pour participer à la conversation.
- Fay
-

- Hors Ligne
- Membre elite
-

Moins
Plus d'informations
- Messages : 236
- Remerciements reçus 96
il y a 5 ans 4 mois #7427
par Fay
Réponse de Fay sur le sujet Variables - using user responses in a Chart page
Hi Yvonne, I've just tried this and can't get it working. I think it will need a change to the chart page to get it working as it's likely that, unlike normal page text, the chart data isn't looked at to see if it contains variables. I should be able to change this but it won't be available until v3.10.
Connexion ou Créer un compte pour participer à la conversation.
- ymoore
-
Auteur du sujet
- Hors Ligne
- Administrateur
-
Moins
Plus d'informations
- Messages : 102
- Remerciements reçus 14
il y a 5 ans 4 mois #7428
par ymoore
Réponse de ymoore sur le sujet Variables - using user responses in a Chart page
Thanks Fay, that would be great.
Yvonne
Yvonne
Connexion ou Créer un compte pour participer à la conversation.
- Fay
-
- Hors Ligne
- Membre elite
-
Moins
Plus d'informations
- Messages : 236
- Remerciements reçus 96
il y a 5 ans 4 mois #7429
par Fay
Réponse de Fay sur le sujet Variables - using user responses in a Chart page
I've just fixed this so you can use variables in the chart/table data on the following pages: chart, table, sortable grid and documentation (within editable tables on this page). The variable markup will be replaced with the appropriate variable on the first view of the page but at the moment the tables/charts won't be redrawn if you later change the values of the variable. I'll log an issue for this to be looked at but it's going to take a bit of thinking about the best way for me to get this working so is unlikely to be done in time for v3.10. Hopefully the quicker fix I've put in for now will be helpful though
Les utilisateur(s) suivant ont remercié: ymoore
Connexion ou Créer un compte pour participer à la conversation.
- ymoore
-
Auteur du sujet
- Hors Ligne
- Administrateur
-
Moins
Plus d'informations
- Messages : 102
- Remerciements reçus 14
il y a 2 ans 9 mois #8826
par ymoore
Réponse de ymoore sur le sujet Variables - using user responses in a Chart page
Hi Fay
I've come back to this during my testing for v3.12, which we're about to upgrade to, and I still can't manage to get the chart to use the variables. With Author Support turned on I can see that the variable data is present, but the chart is just blank. Could you explain how this should work with an example?
Thanks
Yvonne
I've come back to this during my testing for v3.12, which we're about to upgrade to, and I still can't manage to get the chart to use the variables. With Author Support turned on I can see that the variable data is present, but the chart is just blank. Could you explain how this should work with an example?
Thanks
Yvonne
Connexion ou Créer un compte pour participer à la conversation.
Modérateurs: ingdon
Temps de génération de la page : 0.140 secondes