Supporting each other
Community forums
|
Welcome,
Guest
|
The place for more technical questions for those who want to create new pagetypes or bespoke functionality.
TOPIC:
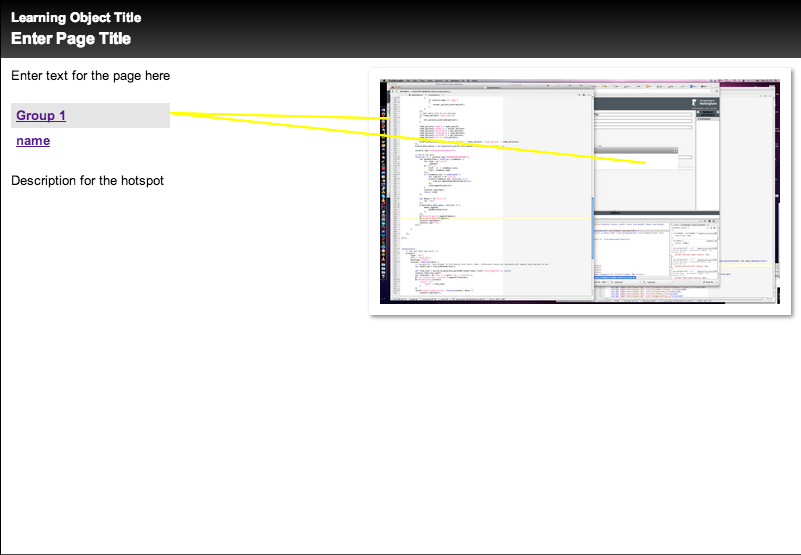
annotated diagram 11 years 9 months ago #1551
|
|
Please Log in or Create an account to join the conversation. |
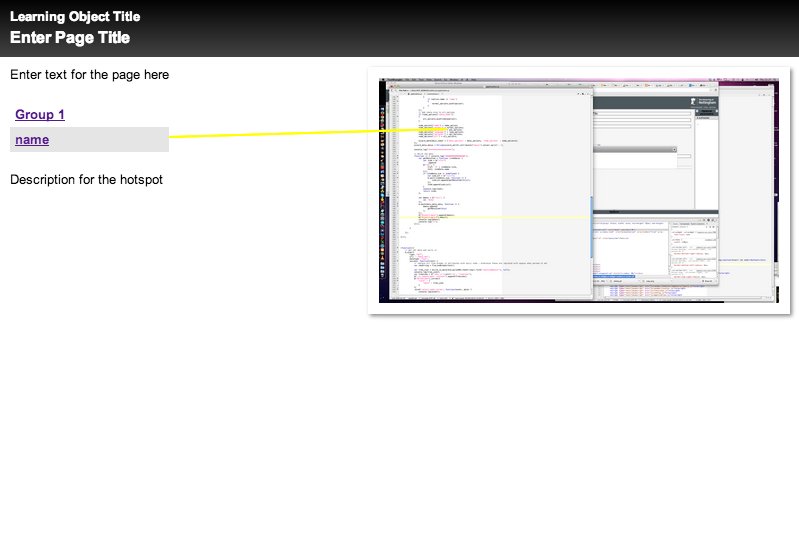
annotated diagram 11 years 9 months ago #1564
|
|
Please Log in or Create an account to join the conversation. |
Moderators: JohnSmith
Time to create page: 0.077 seconds


