Table of Contents
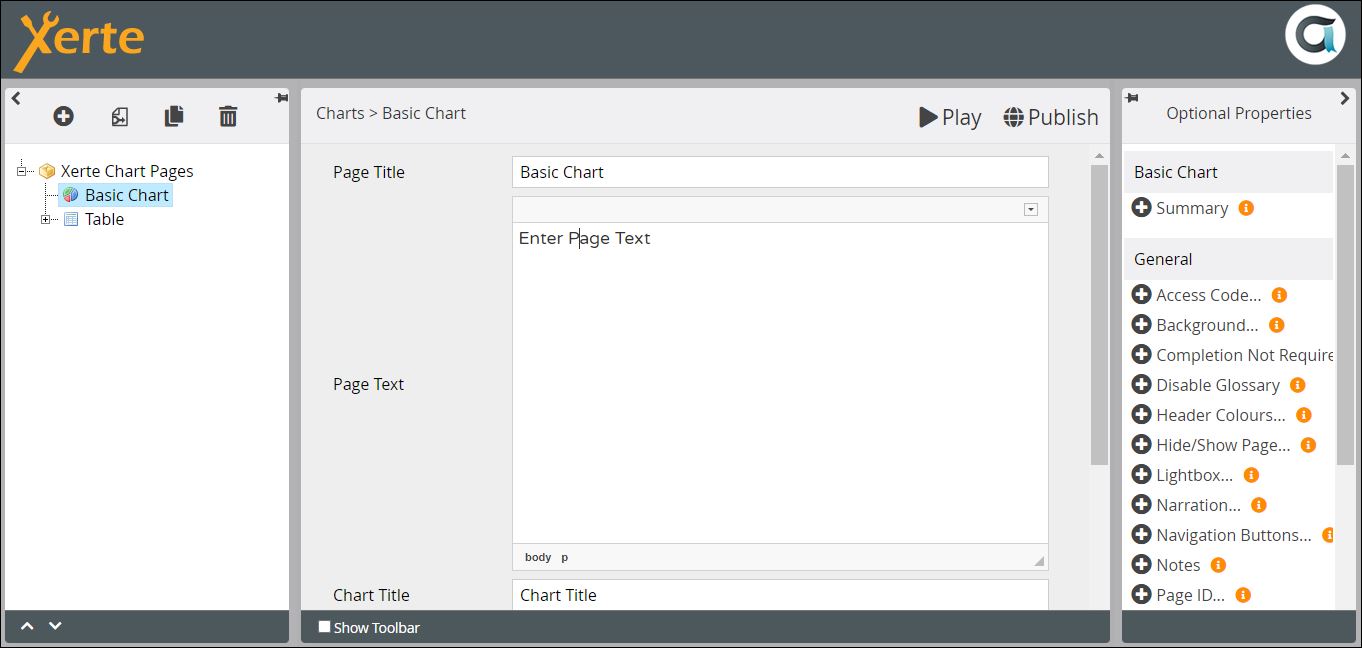
Charts > Basic Chart
A page for creating and displaying a range of charts, including bar charts, stacked bar charts, line graphs and pie charts.
Example demo
or view at Xerte Page Types > Charts: Basic Chart (opens in new tab).
Editor Interface
Top Level: Core Properties
| Property | Description | Type | Additional information |
|---|---|---|---|
| Page Title | Text that appears in header of published page | Text | |
| Page Text | Content that appears in the left pane or at the top of the page (depending on Align Text - see below) | Text+ (Toolbar) | Use this to give the context or instructions for the task. Other content (e.g. images, audio, video) can be embedded here. |
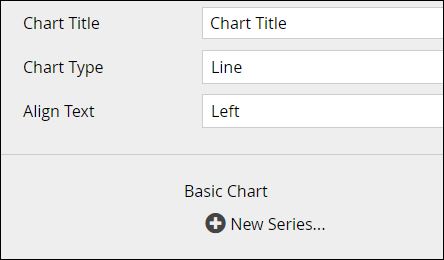
| Chart Title | Title that appears above the chart | Text | |
| Chart Type | Select the type of chart you want {Line/Bar/Stacked Bar/Pie} | Drop- down | Use Stacked Bar when you want to make comparisons between items which each exhibit the same set of variables. |
| Align Text | Swaps round the right and left panes {Left/Right} | Drop- down |
The only page-specific Optional Property is Summary, which enables you to create a summary of the data in the table for accessibility.
See the General Optional Properties page for information on other optional properties.
There are no Language Options for this page type.
Click on New Series to add the data to generate your chart.
Series: Core Properties
| Property | Description | Type | Additional information |
|---|---|---|---|
| Series Name | The text that appears in the button. | Text | |
| Chart data | For basic line, bar and pie charts, enter the labels in the first column and the values in the second. | Table | |
| Colour | The colour theme for the chart. A pie chart uses different shades of the colour chosen, and it is better to choose a darker shade as the starting point. | Colour Picker |

